Benefits of “Row Recycling”
TLDR
Make updates, don’t delete rows just to insert them with small changes.
The Crime Scene
In the shadows of the night, a batch job starts his task at 2 am to clean data. A table with millions of entries and more columns then healthy for any developer gets queried for new entries of the last working day. Each cleaning step comes in chunks of 1 to 10 rows. From here on out, there are three different ways a chunk of rows can develop. Either the number of rows in a chunk increases, stays as it is or decreases. In any way, the content is slightly modified. This batch jobs takes about 2 to 3 hours to complete processing all the chunks sequentially.
The Culprit
To process all chunks, all changed rows of the last working day get fetched and processing starts:
- Start Transaction
- Get all rows of a chunk
- Delete all rows of the chunk from the database
- Modify the row content and row count
- Insert the modified rows of the chunk into the database
- End Transaction
The delete-modify-insert pattern works well for a certain size of table but can get slow as soon as the content of the table gets out of hand. An update could be faster than delete-modify-insert.
Old developers wisdom: Make measurements, especially if in doubt.
Delete and insert operations are expensive because the index has to be updated. It also depends strongly on the tables configuration and database settings. Some databases can handle it very well but in this case it was the reason for a moderate performance.
One Solution: Row Recycling
To optimize chunk processing, keep the rows of a chunk in the database to the moment, when it is clear, how the new chunks look like in terms of row count and content. Three scenarios are possible:
- number of rows stays the same
- number of rows decreases
- number of rows increases
In any case, row content is slightly modified. With that knowledge, it is possible to create a model to understand possible performance benefits. Lets get the hands dirty. The property of interest is speedup $S$, which we could gain from recycling rows to get rid of the delete-modify-insert schema. Speedup is defined as the time the old program (old: delete-modify-insert) takes $T_{o}$ by the time the new program (new: lets call it recycle) $T_{n}$ takes.
$S = \frac{T_{o}}{T_{n}}$
The time a delete-modify-insert $T_{o}$ takes, consists of the time $t_d$ it takes to delete one of $n$ elements and the time $t_i$ to insert one of $m$ elements.
Wait a minute: Where is the time to fetch, modify and send the data?
There are several reasons to remove those considerations. The very first and obvious reason is, the “recycling speedup” I want to show looks much better clearer ;-). Another reason is to keep the model simple for this post. The most reasonable reason is to neglect the latency bound operation becaues the database and batch process are on the same machine. Its an easy task to add more and more reality/complexity to the model which would make a really long post with dozens of parameters. Simplicity is good because one can use available tools at hand (e.g. Mathematica, …) to analyze certain aspects of reality, without the need to develop a professional simulator, which is fun though.
Now lets get the equations going and define $T_{o}$
$T_{o} = n\cdot t_d + m\cdot{} t_i$
The situation for $T_{n}$ is a little bit more complex but still managable, because the three cases (row count increases, stays and decreases) from above are used. The time to update a row is $t_u$.
$T_{n} = \begin{cases} (n-m) \cdot{} t_d & + & m\cdot{}t_u, & \text{if $m<n$} \\
& & m\cdot{}t_u, & \text{if $m=n$} \\
(m-n) \cdot{} t_i & + & n \cdot{}t_u, & \text{if $m>n$} \end{cases}$
I simplified the equation (some Voodoo) with one Assumption: The time it takes to delete a row is the same time it takes to insert a row. This is heavy and it was true for that “crime”. Imagine the length and width of the database table to get such performance behaviour.
$T_n = |n-m|\cdot{}t_d + \text{min($m,n$)}\cdot{}t_u$
Lets put everything into the cooking pot and determine the Speedup.
$S = \frac{T_{o}}{T_{n}} = \frac{n\cdot t_d + m\cdot{} t_d}{|n-m|\cdot{}t_d + \text{min($m,n$)}\cdot{}t_u} = \frac{n+m}{|n-m| + \text{min($m,n$)}\frac{t_u}{t_d}}$
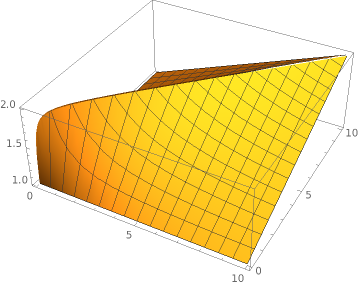
To understand a little bit better, what this means, lets take another perspective on this equation with surface plots. The x-axis is $n$ and the y-axis is $m$. The quotient $\frac{t_u}{t_d}$ is set to 1.0 (update and delete time is equal). The z-axis is representing the Speedup $S$. Here the Mathematica line:
Plot3D[(x+y)/(Abs[x-y]+Min[x,y]*1), {x, 0, 10}, {y, 0, 10}]Now this looks good. In the worst case the speedup of row recycling is as good as without recycling (delete-insert). Things start to look even better if the time for an update is smaller than for a delete/insert. Lets assume an update is 10 times faster than a delete.
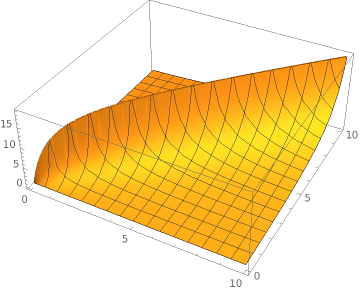
Plot3D[(x+y)/(Abs[x-y]+Min[x,y]*0.1), {x, 0, 10}, {y, 0, 10}]Now this shark fin is a good result. Lets push things one order of magnitude and assume an update is 100 times faster than a delete/insert.
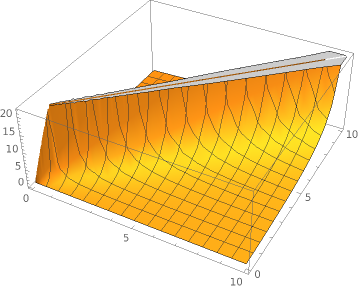
Plot3D[(x+y)/(Abs[x-y]+Min[x,y]*0.01), {x, 0, 10}, {y, 0, 10}]Ok ok but what happens if the time of an update is 10 times slower than an delete/insert?
Plot3D[(x+y)/(Abs[x-y]+Min[x,y]*10), {x, 0, 10}, {y, 0, 10}]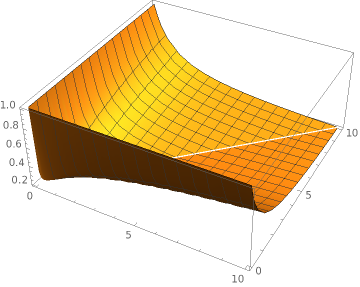
This does not look very good but every coin has two sides. Its somehow clear, if an update takes 10 times the time of a delete or insert, that the update centric approach ist slower. Heads up. This is not the end. Something interesting happens if the time for an update is two times the time of a delete/insert.
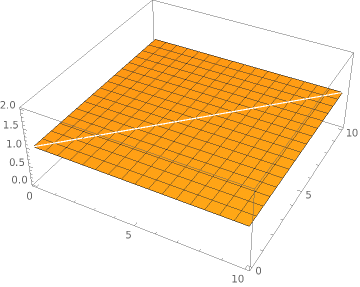
Plot3D[(x+y)/(Abs[x-y]+Min[x,y]*2.0), {x, 0, 10}, {y, 0, 10}]This is very interesting, since there is no speedup at all. This shows, that it is possible that an optimization can have no speedup at all. Imagine the confusion analysing such behaviour after a performance optimization.
All in all its imperative to understand and proof performance bottlenecks before conducting an optimization like “row recycling”. The delete-insert method has benefits if the update takes way to long but the update is clearly benefitial if the update time is equal to the delete/insert time for this use case.
There are more things to explain around this use case, more things to discuss and more things to analyse. If you like, let me know.
